Session Review
References
https://pixabay.com/en/house-home-icon-symbol-sign-309113/
https://pbs.twimg.com/media/BprQZtAIgAAeltR.jpg
https://upload.wikimedia.org/wikipedia/commons/thumb/5/58/British_Isles_(orthographic_projection).svg/2000px-British_Isles_(orthographic_projection).svg.png
By Sebastian Jones
 |
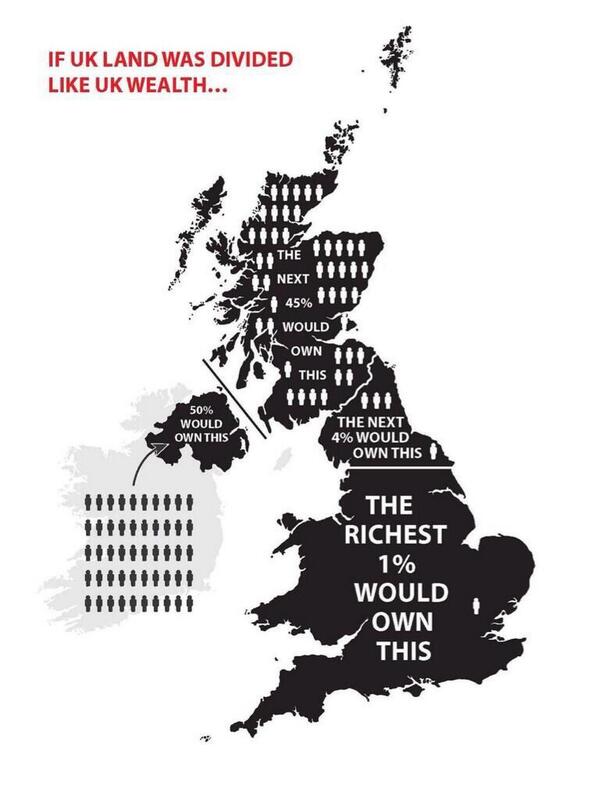
| Experimenting with various visual concepts for infographic |
Early in the afternoon, I contemplated further on my basic infographic concept of having symbols of houses to represent the number of new homes being built within the United Kingdom.
Moreover, this concept has evolved where multiple symbols of houses will be placed around the landmass of the UK depicting the amount of houses being built in specific areas and finally having a numerical percentage indicating the estimated amount of homes built within that area.
References
https://pixabay.com/en/house-home-icon-symbol-sign-309113/
https://pbs.twimg.com/media/BprQZtAIgAAeltR.jpg
https://upload.wikimedia.org/wikipedia/commons/thumb/5/58/British_Isles_(orthographic_projection).svg/2000px-British_Isles_(orthographic_projection).svg.png
.svg/2000px-British_Isles_(orthographic_projection).svg.png)
By Sebastian Jones
Comments
Post a Comment